
What Is a Wind Rose? How to Read and Use Wind Data
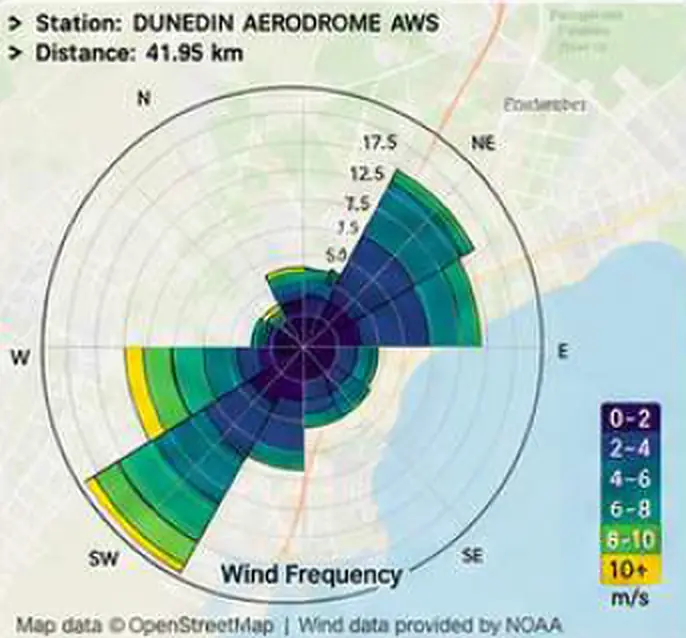
A wind rose is a circular chart that summarizes wind patterns at a particular location over a selected period. It shows where the wind usually comes from, how frequently it arrives from different directions and, in many charts, the range of wind speeds recorded.
Instead of presenting thousands of weather observations in a spreadsheet, a wind rose turns the data into a visual pattern. Engineers, architects, environmental researchers and planners can use that pattern to better understand the wind conditions affecting a location.
A wind rose is a statistical summary, not a weather forecast. It describes the measurements or modeled data used to create it and does not predict the wind at a particular future time.
What Does a Wind Rose Show?
A typical wind rose combines three types of information:
- Direction: Where the wind came from
- Frequency: How often the wind came from each direction
- Speed: The distribution of wind speeds recorded within each direction
Some wind roses also report calm conditions, when the wind speed was below a defined threshold.
Wind rose designs vary, so the title, legend, units, scale and data period should always be checked before interpreting the chart.
How to Read a Wind Rose
A wind rose can be understood by looking at four features:
- Direction: Each wedge shows where the wind came from. A wedge pointing north represents wind blowing from north to south.
- Length: A longer wedge means the wind arrived from that direction more frequently. The circular scale usually shows the frequency as a percentage.
- Color: Colors represent different wind-speed ranges. Check the legend because the ranges and units can vary.
- Center: Some charts show the percentage of calm or very light wind conditions in the center.
The longest wedge normally shows the most frequent wind direction, but not necessarily the strongest winds. Always check both the wedge length and its colors.
What Is a Prevailing Wind?
A prevailing wind is the direction from which the wind most frequently arrives during a specified period.
This does not mean that the wind always comes from that direction. Wind conditions change with weather patterns, seasons and time of day. Some locations may also have more than one common wind direction.
The prevailing direction may not represent the strongest or most demanding wind condition. For example, a site might experience gentle southerly winds frequently but occasional strong northwesterly winds. The southerly wind may be the prevailing condition, while the northwesterly wind may be more important for a particular design question.
Why Does the Data Period Matter?
Every wind rose represents a defined period. It may summarize data from a month, a season, a year or several years.
An annual wind rose provides a broad view of the wind climate, but shorter-period charts may reveal patterns that an annual summary conceals. The most appropriate period depends on the purpose of the analysis.
Longer datasets generally provide a stronger basis for understanding typical conditions, provided that the data are complete, consistent and relevant to the location.
Why Is Wind Rose Data Useful?
A wind rose makes directional patterns easier to recognize than a table of individual measurements. People can use those patterns to select conditions for further investigation and make better-informed early design decisions.
Building Design and Urban Planning
Architects and engineers can use wind rose data to understand which sides of a site are most frequently exposed to incoming wind. This information can support early consideration of:
- Building orientation
- Window and opening placement
- Natural-ventilation opportunities
- Courtyard and street layouts
- Outdoor seating and pedestrian spaces
- Areas that may require detailed airflow analysis
A wind rose does not calculate ventilation performance, pedestrian comfort or structural wind loads. Building geometry, surrounding structures, terrain, temperature differences and turbulence also affect airflow.
HVAC and Ventilation
Designers can use prevailing wind information when investigating natural or mixed-mode ventilation. Wind direction and speed affect pressure around a building, which can influence how air enters and leaves through openings.
However, a wind rose alone cannot determine whether a ventilation system will perform adequately. Opening sizes, internal layouts, thermal buoyancy and mechanical systems must also be considered.
Wind Energy
Wind direction is an important part of wind-resource assessment. Terrain, buildings and vegetation can create sheltered areas, alter wind speed and generate turbulence.
A wind rose can help people understand the prevailing directions at a potential site, but turbine siting requires additional information. This may include long-term wind-speed data, turbulence intensity, vertical wind shear, extreme conditions and measurements taken near the proposed turbine height.
Environmental Studies
Environmental researchers can use wind roses to examine the wind directions present during a monitoring period and select representative conditions for pollutant-, dust- or odor-dispersion studies.
A wind rose cannot predict dispersion by itself or prove the source of a measured pollutant. A detailed assessment may also require emissions data, atmospheric conditions, terrain information and an appropriate dispersion model.
Education
Wind roses provide an accessible way to introduce weather observations, directional data and frequency distributions. Students can use them to explore how wind patterns vary between locations and how incoming wind interacts with buildings and other objects.
How Can Wind Rose Data Support CFD?
Engineers use computational fluid dynamics, or CFD, to simulate how air moves around buildings, terrain and other objects. When setting up an external-airflow simulation, the user normally specifies an incoming wind direction and speed.
A wind rose can guide this selection by showing which wind conditions occur most frequently in the available dataset. For a typical steady airflow study, the user selects one representative wind direction and speed for each simulation. If several directions are important, separate simulations can be run and compared.
A single simulation does not automatically represent every direction and speed displayed in the wind rose.
Wind rose data can therefore support the selection of representative CFD inputs, but it does not guarantee an accurate result. Reliability also depends on the geometry, boundary conditions, mesh, physical models, numerical settings and suitability of the wind data.
Using Wind Rose Data in AirSketcher
AirSketcher is a two-dimensional airflow simulation and ventilation design tool built on CFD. Its wind rose feature provides average wind information for a selected location, helping users identify prevailing wind directions, their frequency and associated wind-speed information.
Users can refer to the wind rose when choosing a representative incoming wind direction and speed. They can then orient their sketch relative to the incoming wind and investigate how air may move around buildings, openings or other objects.
Wind rose information in AirSketcher can help users:
- Identify the prevailing wind direction
- Understand how frequently wind arrives from different directions
- Select a representative wind direction and speed
- Orient a 2D model relative to the incoming airflow
- Compare simulations created using different wind directions
- Investigate pressure, recirculation and sheltered areas
The wind rose serves as a guide for selecting meaningful simulation conditions. It does not transfer all the wind conditions displayed in the chart into a single CFD calculation.
The information must also be interpreted in context. A wind rose summarizes its underlying dataset, and its relevance can depend on the data location, observation period, measurement height and surrounding terrain. Conditions at a specific building or project site may differ from the broader location-based data.
AirSketcher provides a two-dimensional representation of airflow. More detailed analysis may be required when three-dimensional effects, complex terrain, structural wind loading or safety-critical design decisions are important.
Turning Wind Data Into Airflow Insight
A wind rose makes the history of the wind visible. Its wedges reveal where the wind most frequently came from, while its colors show the associated range of wind speeds.
Its value lies in helping people recognize patterns and choose sensible conditions for further investigation. When interpreted carefully, wind rose data can support better questions, more representative airflow simulations and a clearer understanding of how a location interacts with the wind.